Competition 2018: Nominated in the category Research
Visualising fatalities in Washington DC
Mapbox, 2017
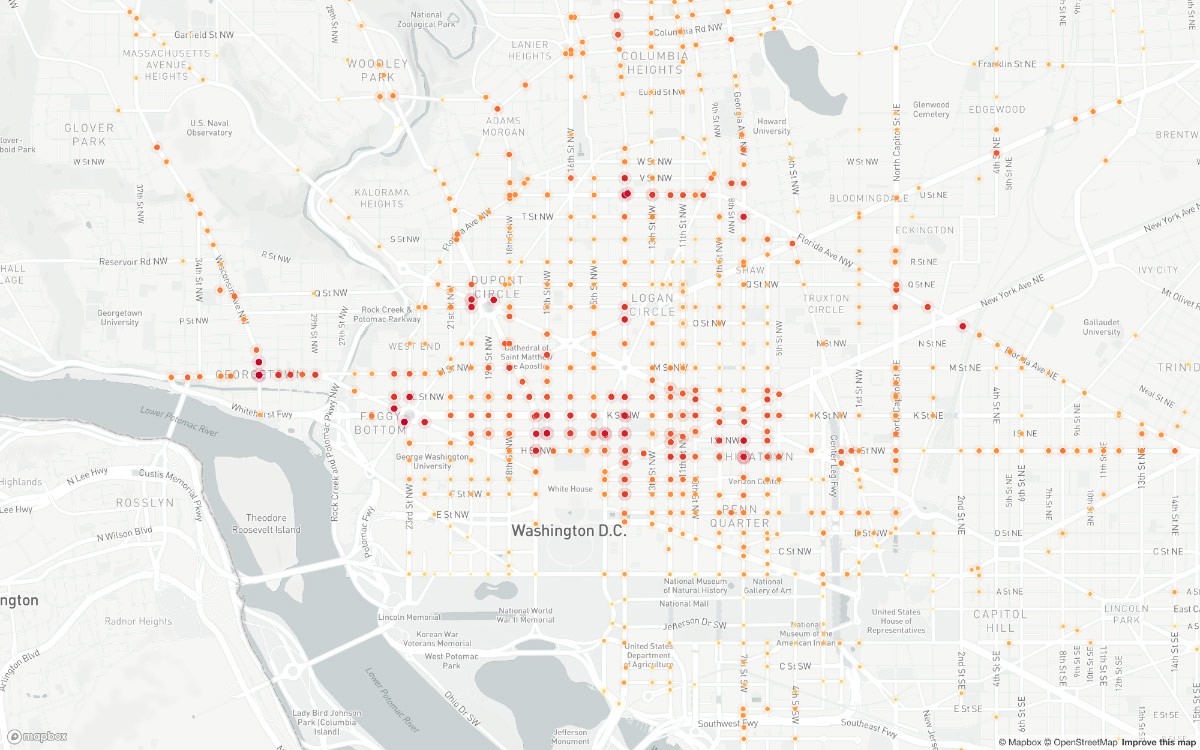
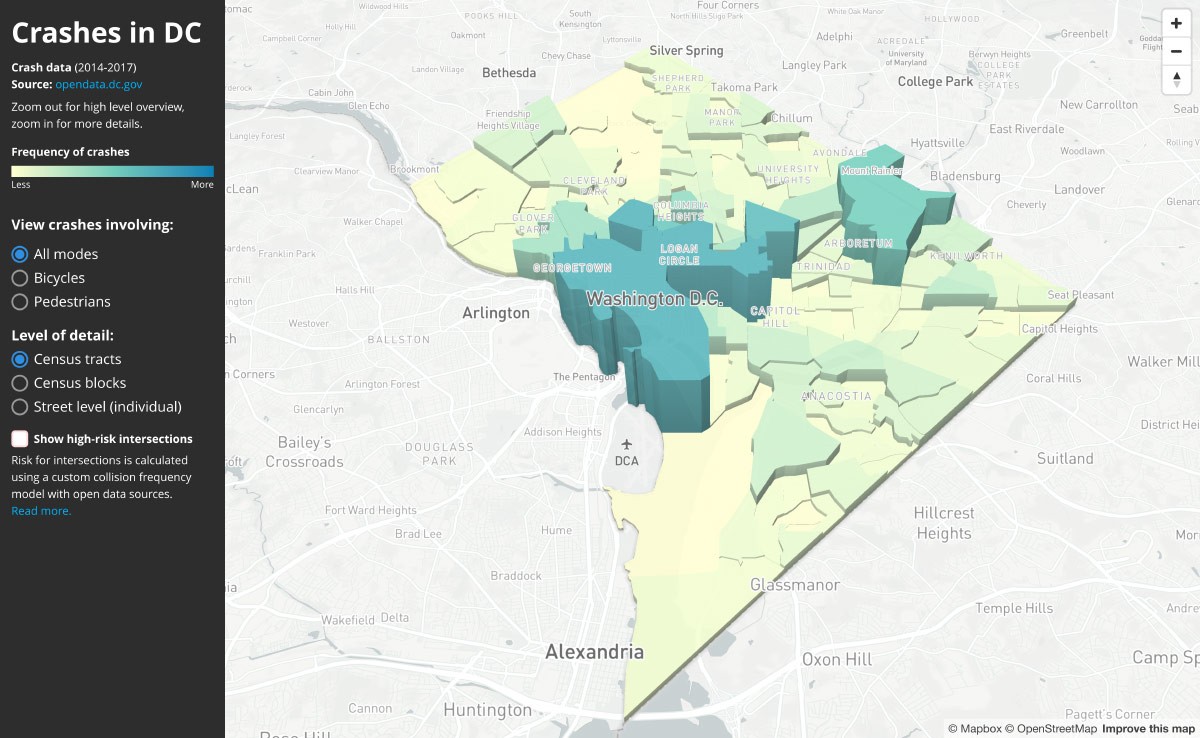
What can city analyze historical traffic fatality data and predict areas with high risk of fatalities in the future? Using open data on traffic incidents from the Washington DC's District Department of Transportation (DDOT), combined with anonymous sensor data, we?ve visualized traffic fatalities in the last few years, and identified the highest risk areas to focus interventions.
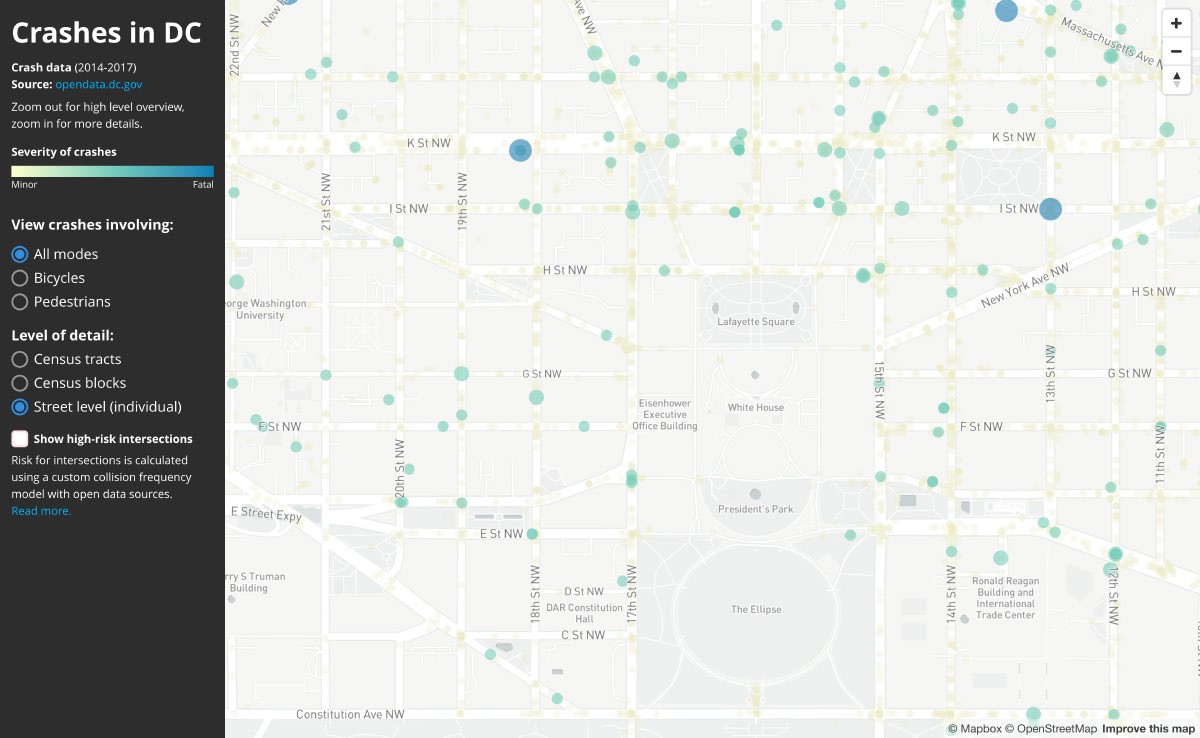
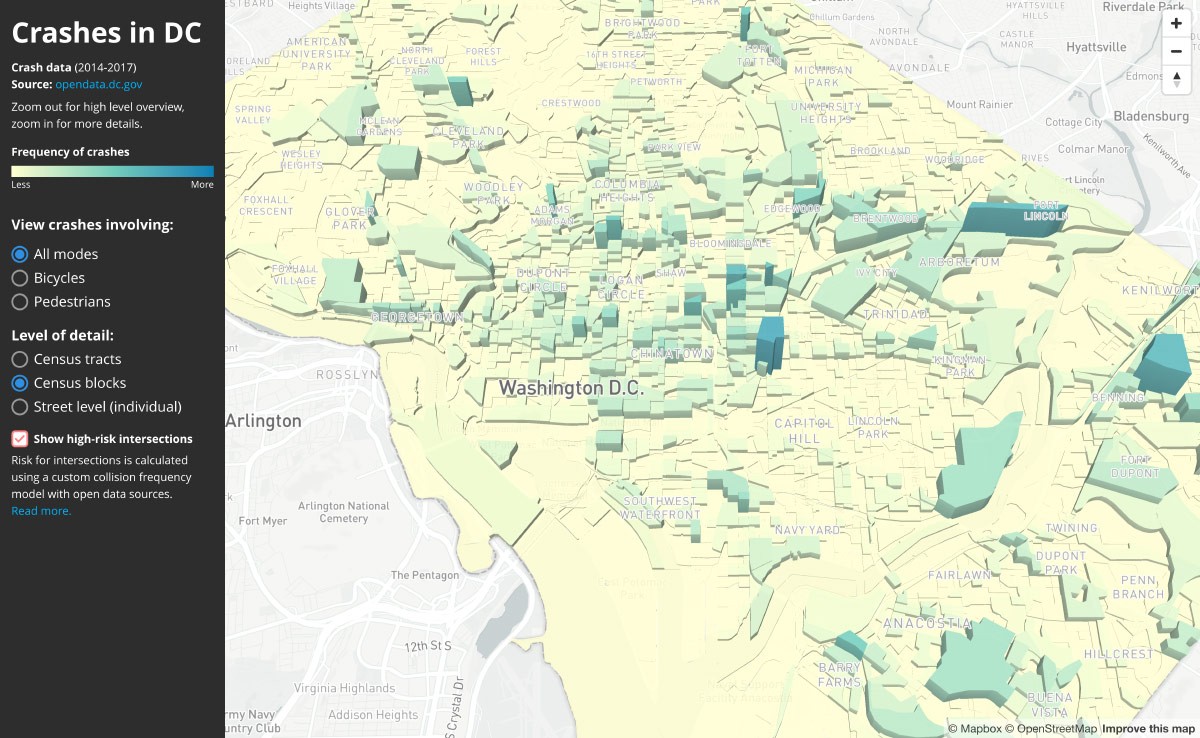
We began by examining the distribution of crashes in 3D, aggregated to census tracts and census blocks. For example, at the block level, you can see that Union Station stands out as one particular hot spot of crash incidents. You can further zoom in to see individual accidents, visualized as circles that vary in size and color to reflect the severity of each accident.
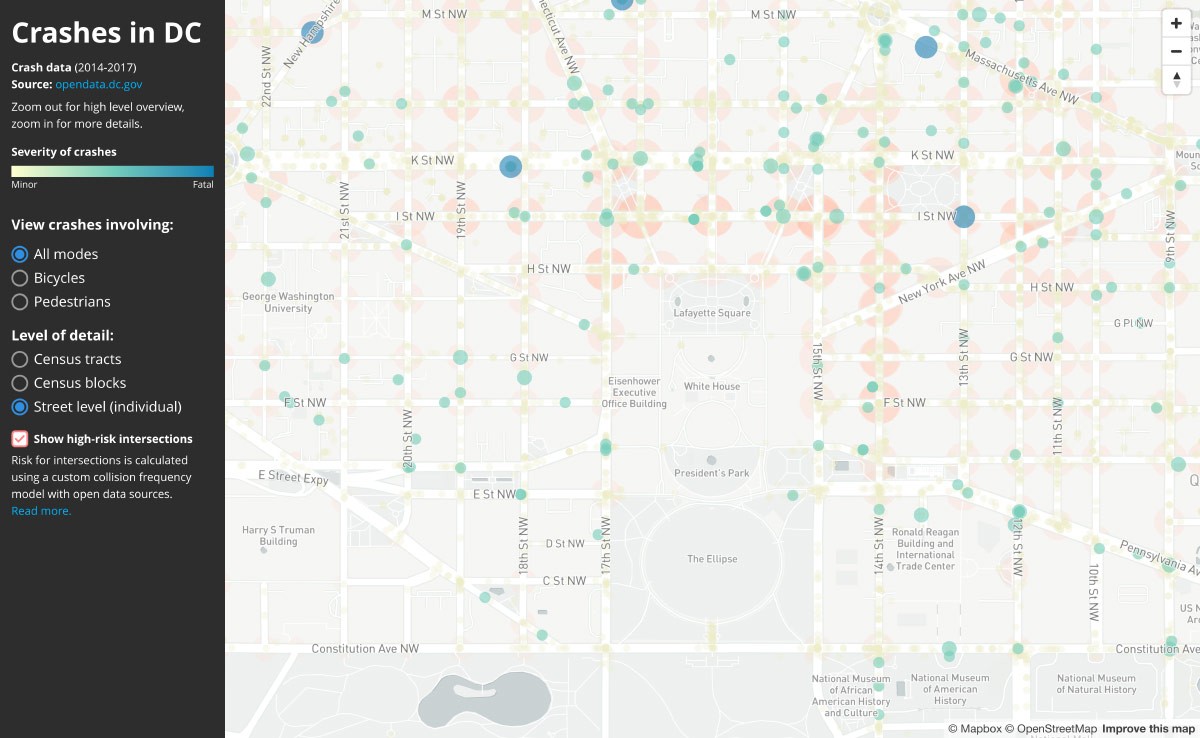
To identify high risk areas for crashes in DC, we built a collision frequency model that compares several open datasets and sensor data. We looked at the number of incidents normalized by the volume of vehicles and pedestrians and analyzed how incidents correlate to the density of businesses, schools, intersections, employment, census data, and driving speeds.

Links
- https://blog.mapbox.com/open-c...
- https://www.mapbox.com/bites/0...
- https://www.washingtonpost.com...
Authors
Project Partner
District Department of Transportation (DDOT), Washington DC