Competition 2016: Shortlisted in the category Journalistic
Fabric of a City
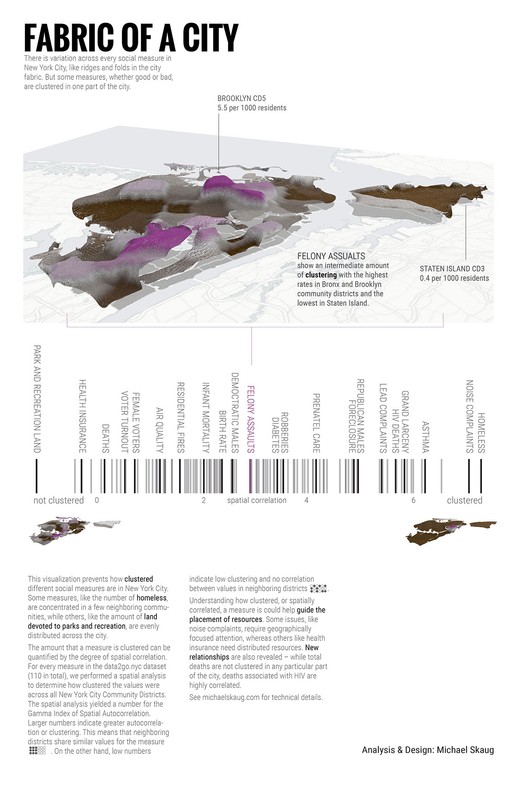
Measure of America and data2go.nyc, 2016Every New York City community district is unique and when you look at the different civic measures, you see highs and lows like the ridges and folds in a piece of fabric. For some measures, the highs and lows are sprinkled randomly across the city, whereas for others, the highs and lows are clustered in particular areas. This visualization explores that clustering and enables comparison between measures based on how spatially clustered each measure is. The visualization highlights the spatial context and geographic layout of the data, rather than the absolute values. It could help guide the placement of resources and raises new questions about why certain measures are highly clustered.
Authors
Project Partner
Measure of America and data2go.nyc