Mapping Protest in 3D with Twitter Data
Centre for Advanced Spatial Analysis, University College London, 2016
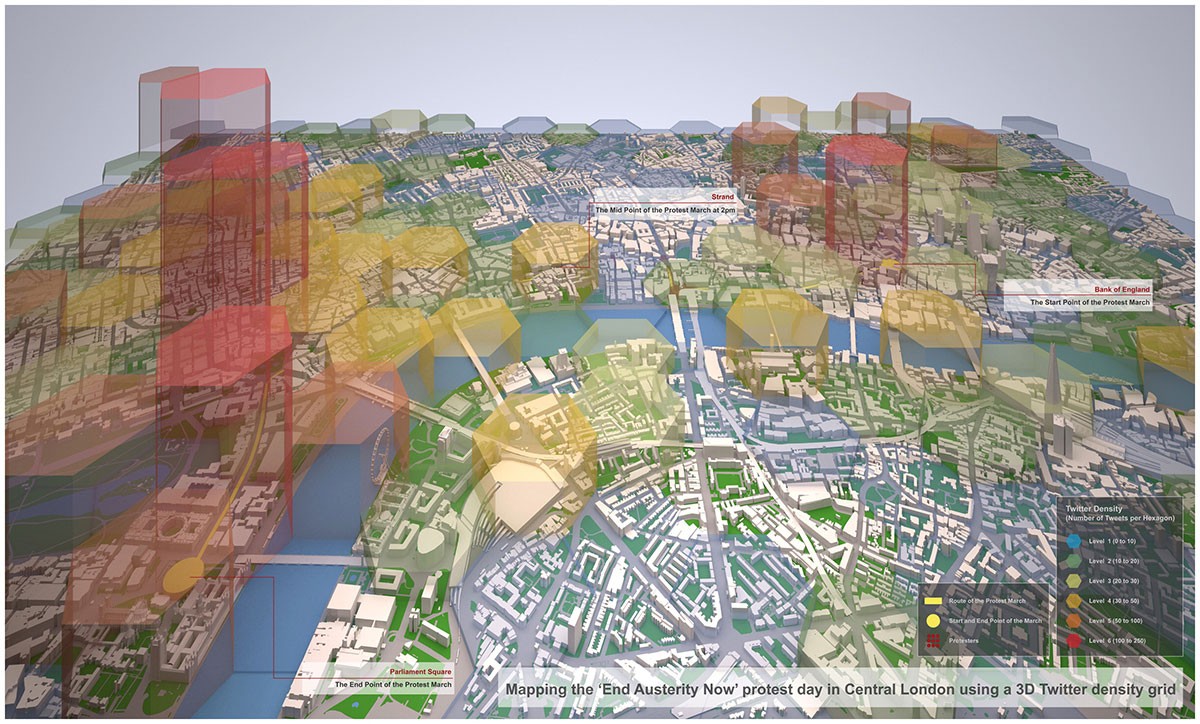
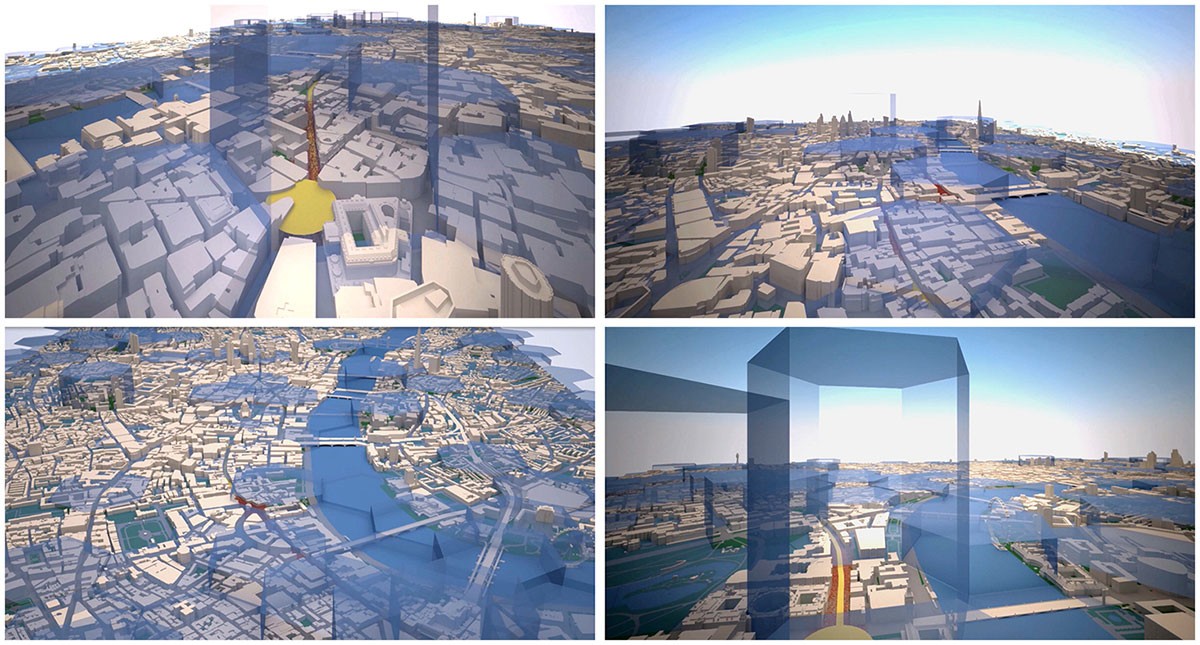
The mapping and spatial analysis of social media data can show the dynamics of activities in urban space, such as protest events. This work focuses on the spatial relationship between the density of geo-tagged tweets and a large anti-government protest in London on 20 June 2015. The tweets are aggregated to hexagonal grid cells to visualize activity density in different Central London areas. The results of the mapping illustrate very high densities at the beginning and endpoints of the protest (the Bank of England and Parliament Square). Additionally, there are high tweet densities in the West End and Bank than in other neighbouring areas.
This interaction between urban space and Internet Communication (ex. social media) is expected to be strengthened in the future as ICTs technology will be developed and people will participate in diverse issues more than before.