Competition 2016: Shortlisted in the category Research
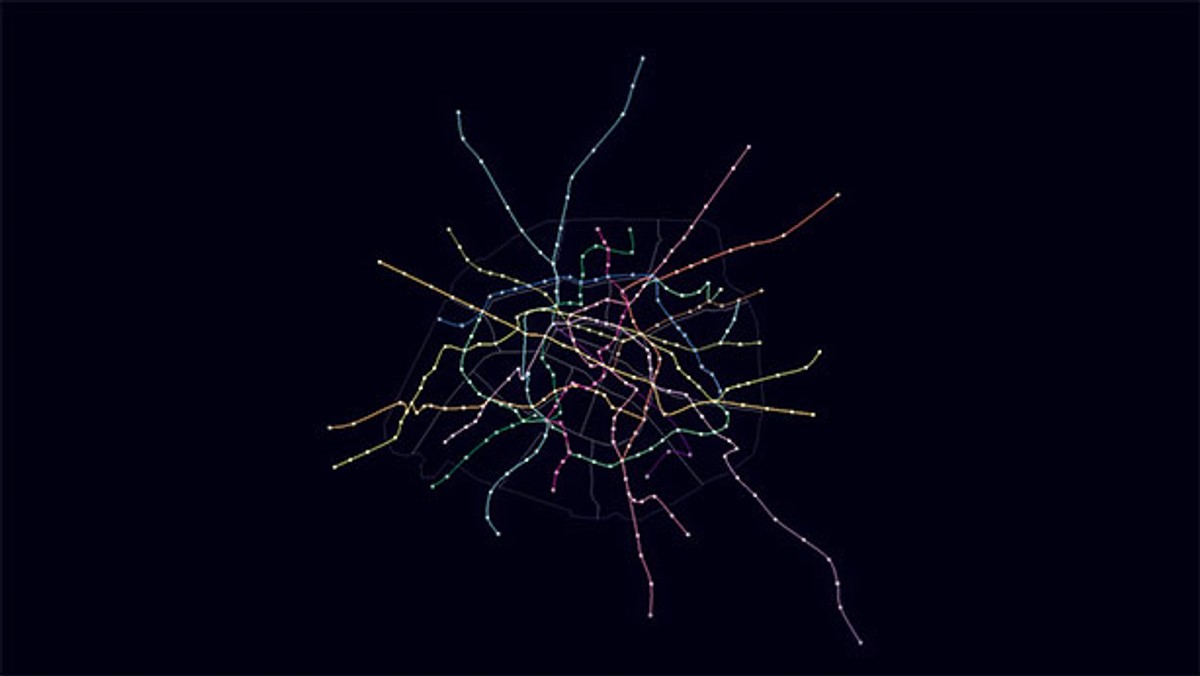
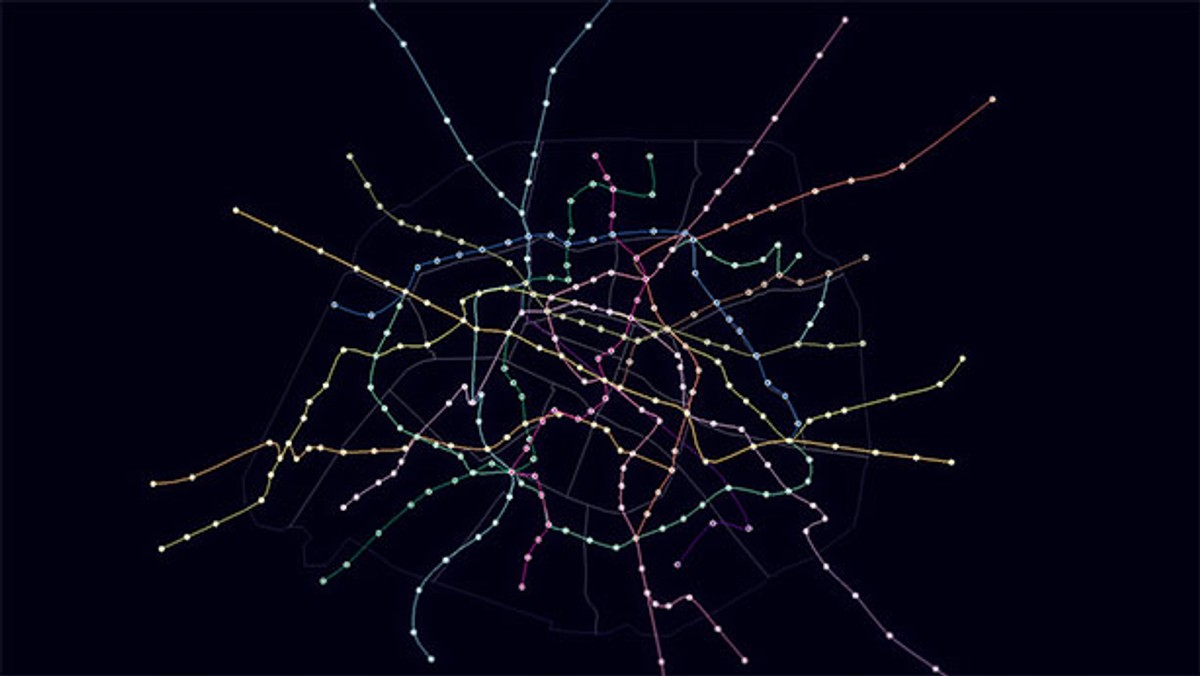
A new representation of our transport network shaped by metro data
Dataveyes, 2012
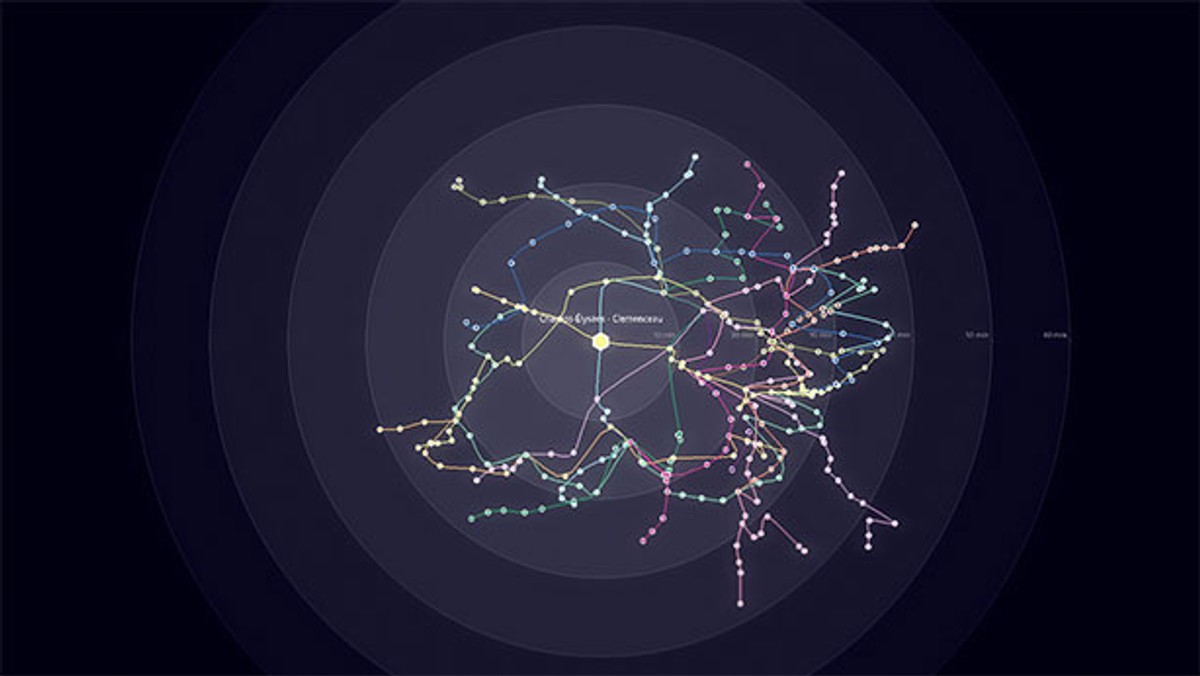
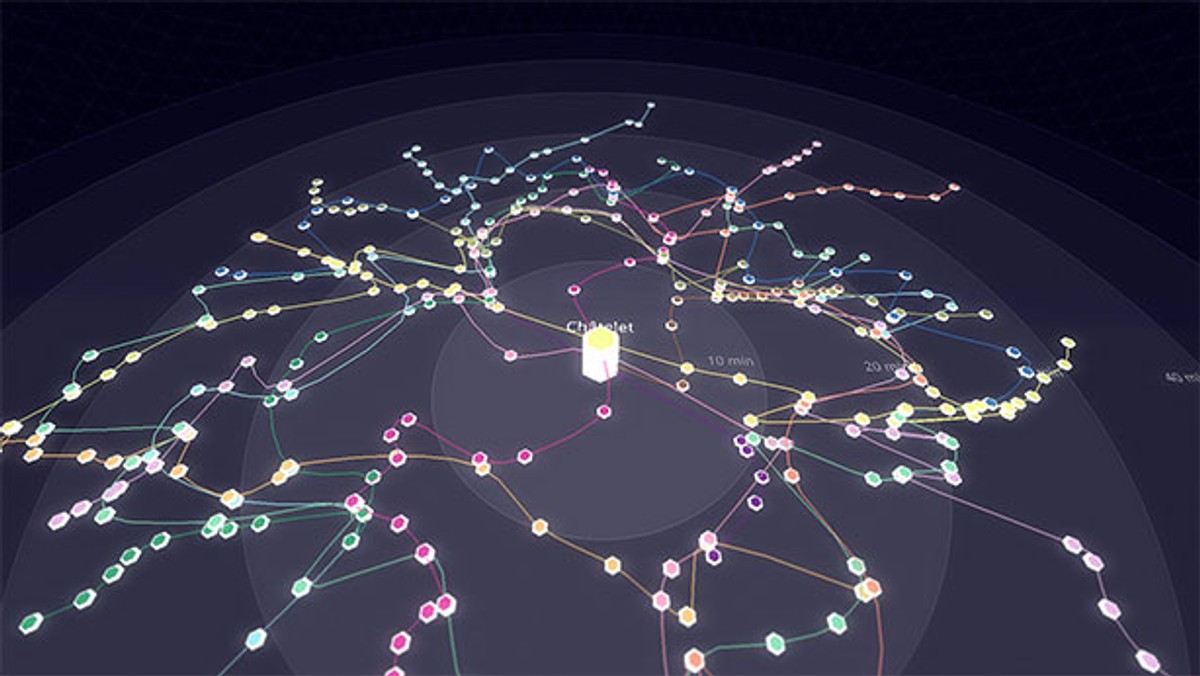
Metropolitain.io is led by Dataveyes? very own R&D lab. The project attempts to visualize and make sense out of Paris urban data. The interface enables users to interrogate datasets around journey time between metro stations, at any hour of the day, as well as the number of people touching in at each station.
The data around crowd turnouts was made openly available by the RATP (Autonomous Operator of Parisian Transports). Other datasets about time between stations were provided by the start-up Isokron (who realized the Locomote App).
The metro map is no longer arbitrarily dictated by the spatial distance between two points. By playing around with two extra variables ? time and crowds ? users can transform the map, view it in 3D and unveil the true reality behind their daily commute.
We wanted to liven up the traditional maps of the Parisian underground system, in a way that better matches the reality of commuting.