Measuring & Visualizing Transit Accessibility in Denmark
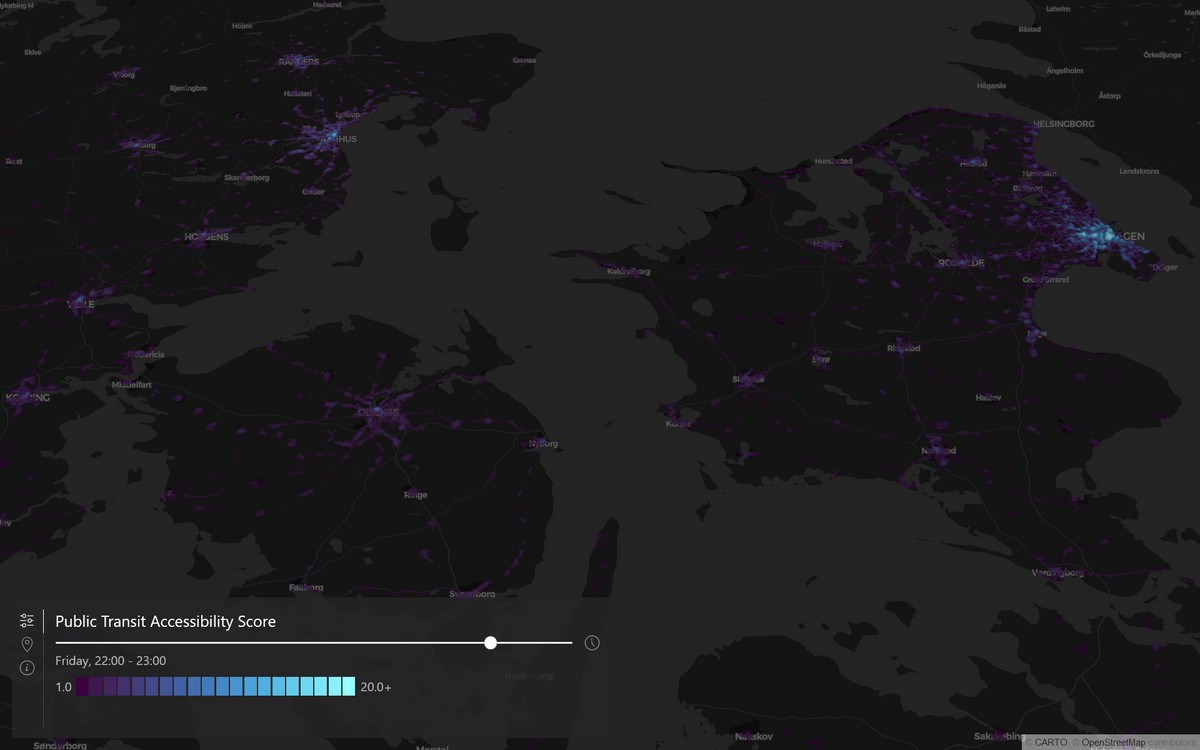
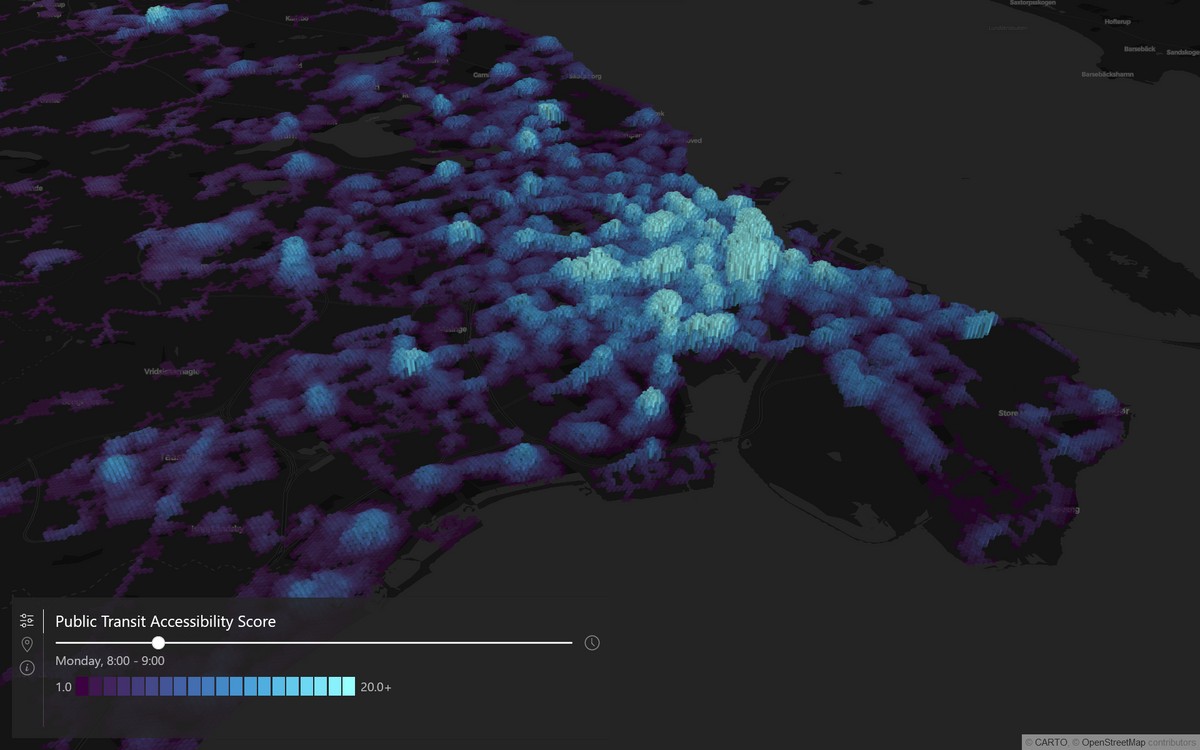
IT University of Copenhagen (ITU), 2022Based on timetable data, we created a metric that quantifies transit accessibility across Denmark. To set this project apart from already existing ones, we added a fourth dimension to accessibility scoring - time. We built a powerful data processing engine to calculate scores at a high resolution and created an interactive visualization for it. We find significant differences in transit accessibility between the two largest cities in Denmark, especially at Night. See the result here: https://potatotvnet.github.io/transit/