Visualising TFL Accident Data
QuantumBlack, 2016
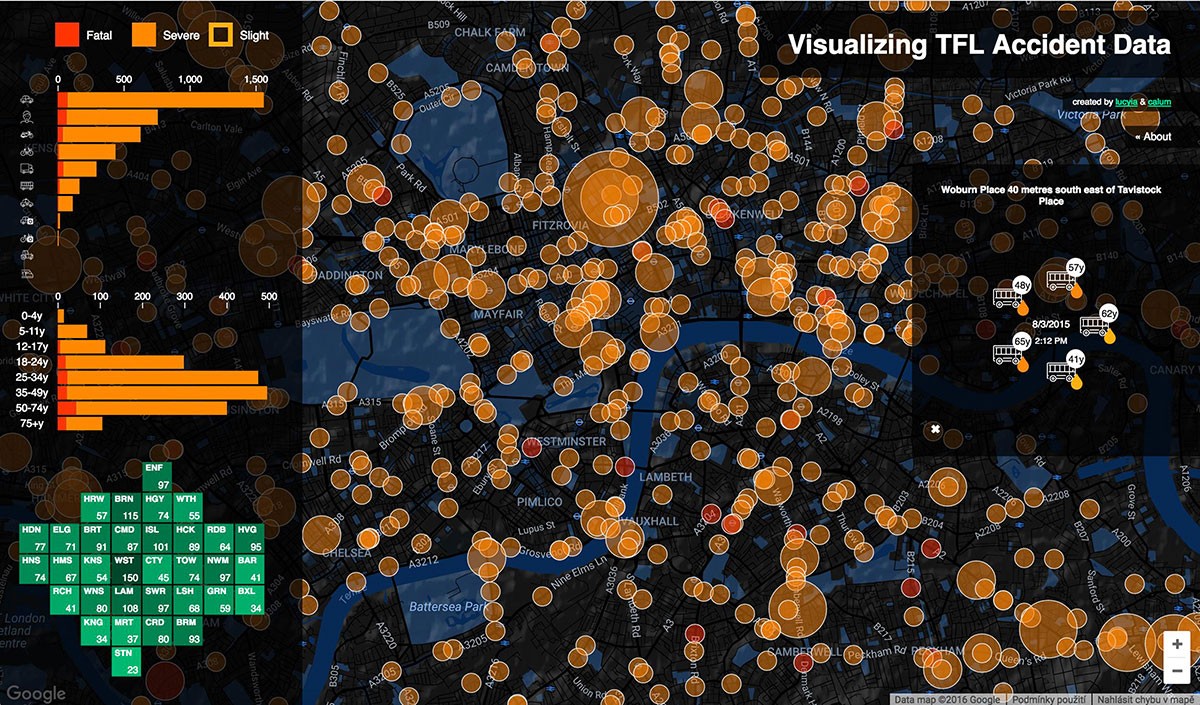
This interactive visualisation aims to display traffic accident information as kept by Transport for London for the year 2015. The traffic incidents are plotted geographically on the map, colour coded by severity, and there are some interactive summary statistics in the left panel.
Interactive elements highlight on hover, and can be clicked to filter the selection. The supplementary information is broken down by vehicle type, by the age-range of the people involved in the incidents and also by the London borough in which the incident occurred.
Feel free to explore the data and discover the accident hotspots in London!