
In the lead-up to the UN conference Habitat III, the open call Visualizing Cities requested submissions of the best city visualizations conceived by designers, researchers and practitioners around the world. The entries were carefully reviewed by an international program committee of experts from urban studies, visualization research and media outlets. The five winning entries were presented at the event and exhibition space Habitat X Change during Habitat III in Quito, Ecuador.
 Research
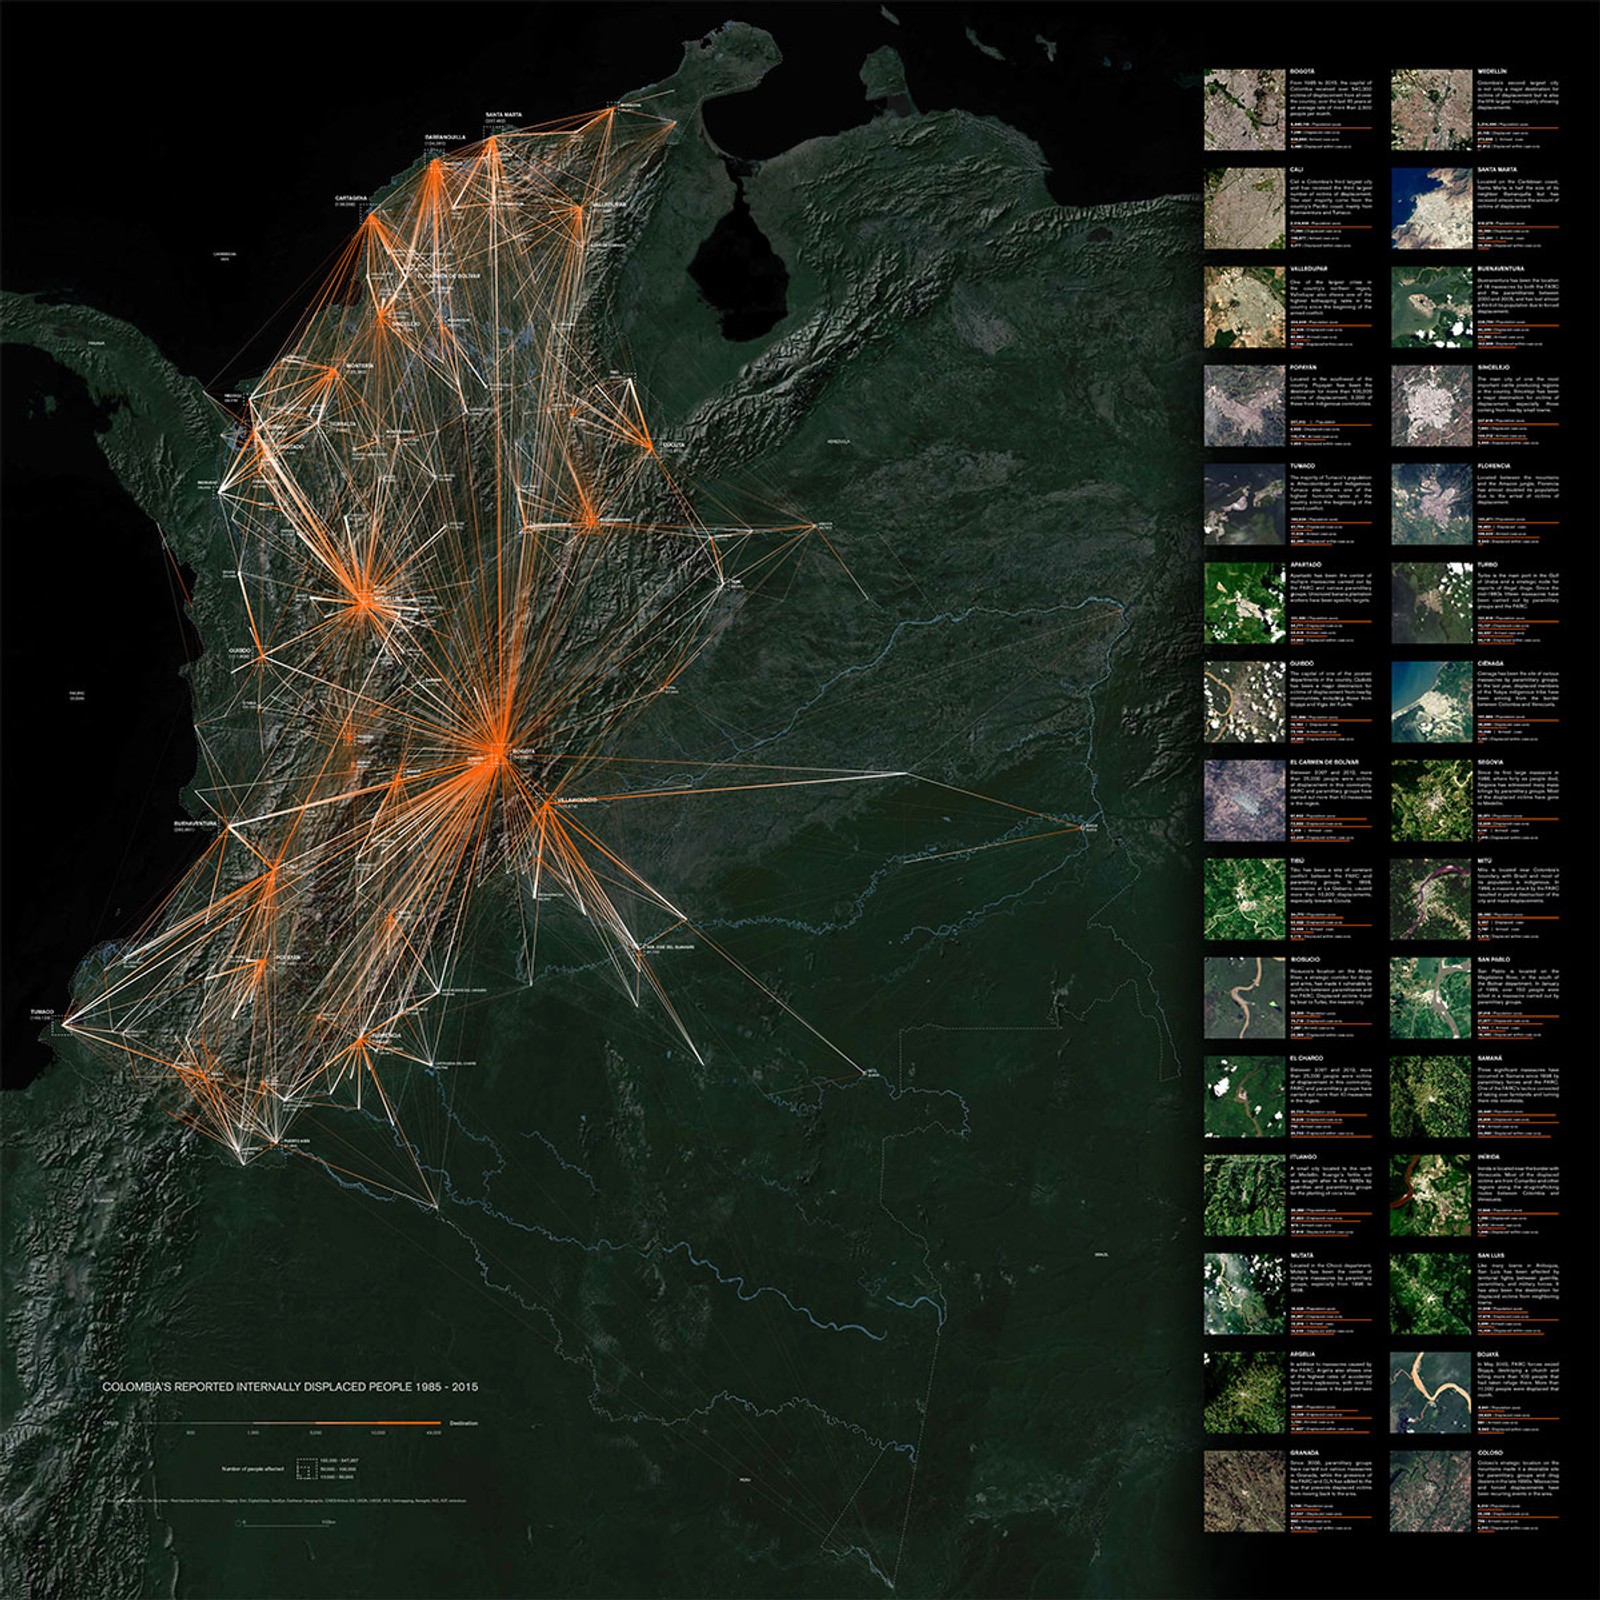
Conflict Urbanism: Colombia
Center for Spatial Research, Columbia University
This work explores the migration patterns caused by the Colombian conflict between guerrillas, military and paramilitaries. The map shows an overview of the routes of internally displaced people in Colombia from 1985 to 2015, which were mostly from rural to urban areas. This project illustrates in a stirring way how urbanization is also forcefully driven by armed conflict.
 Contract
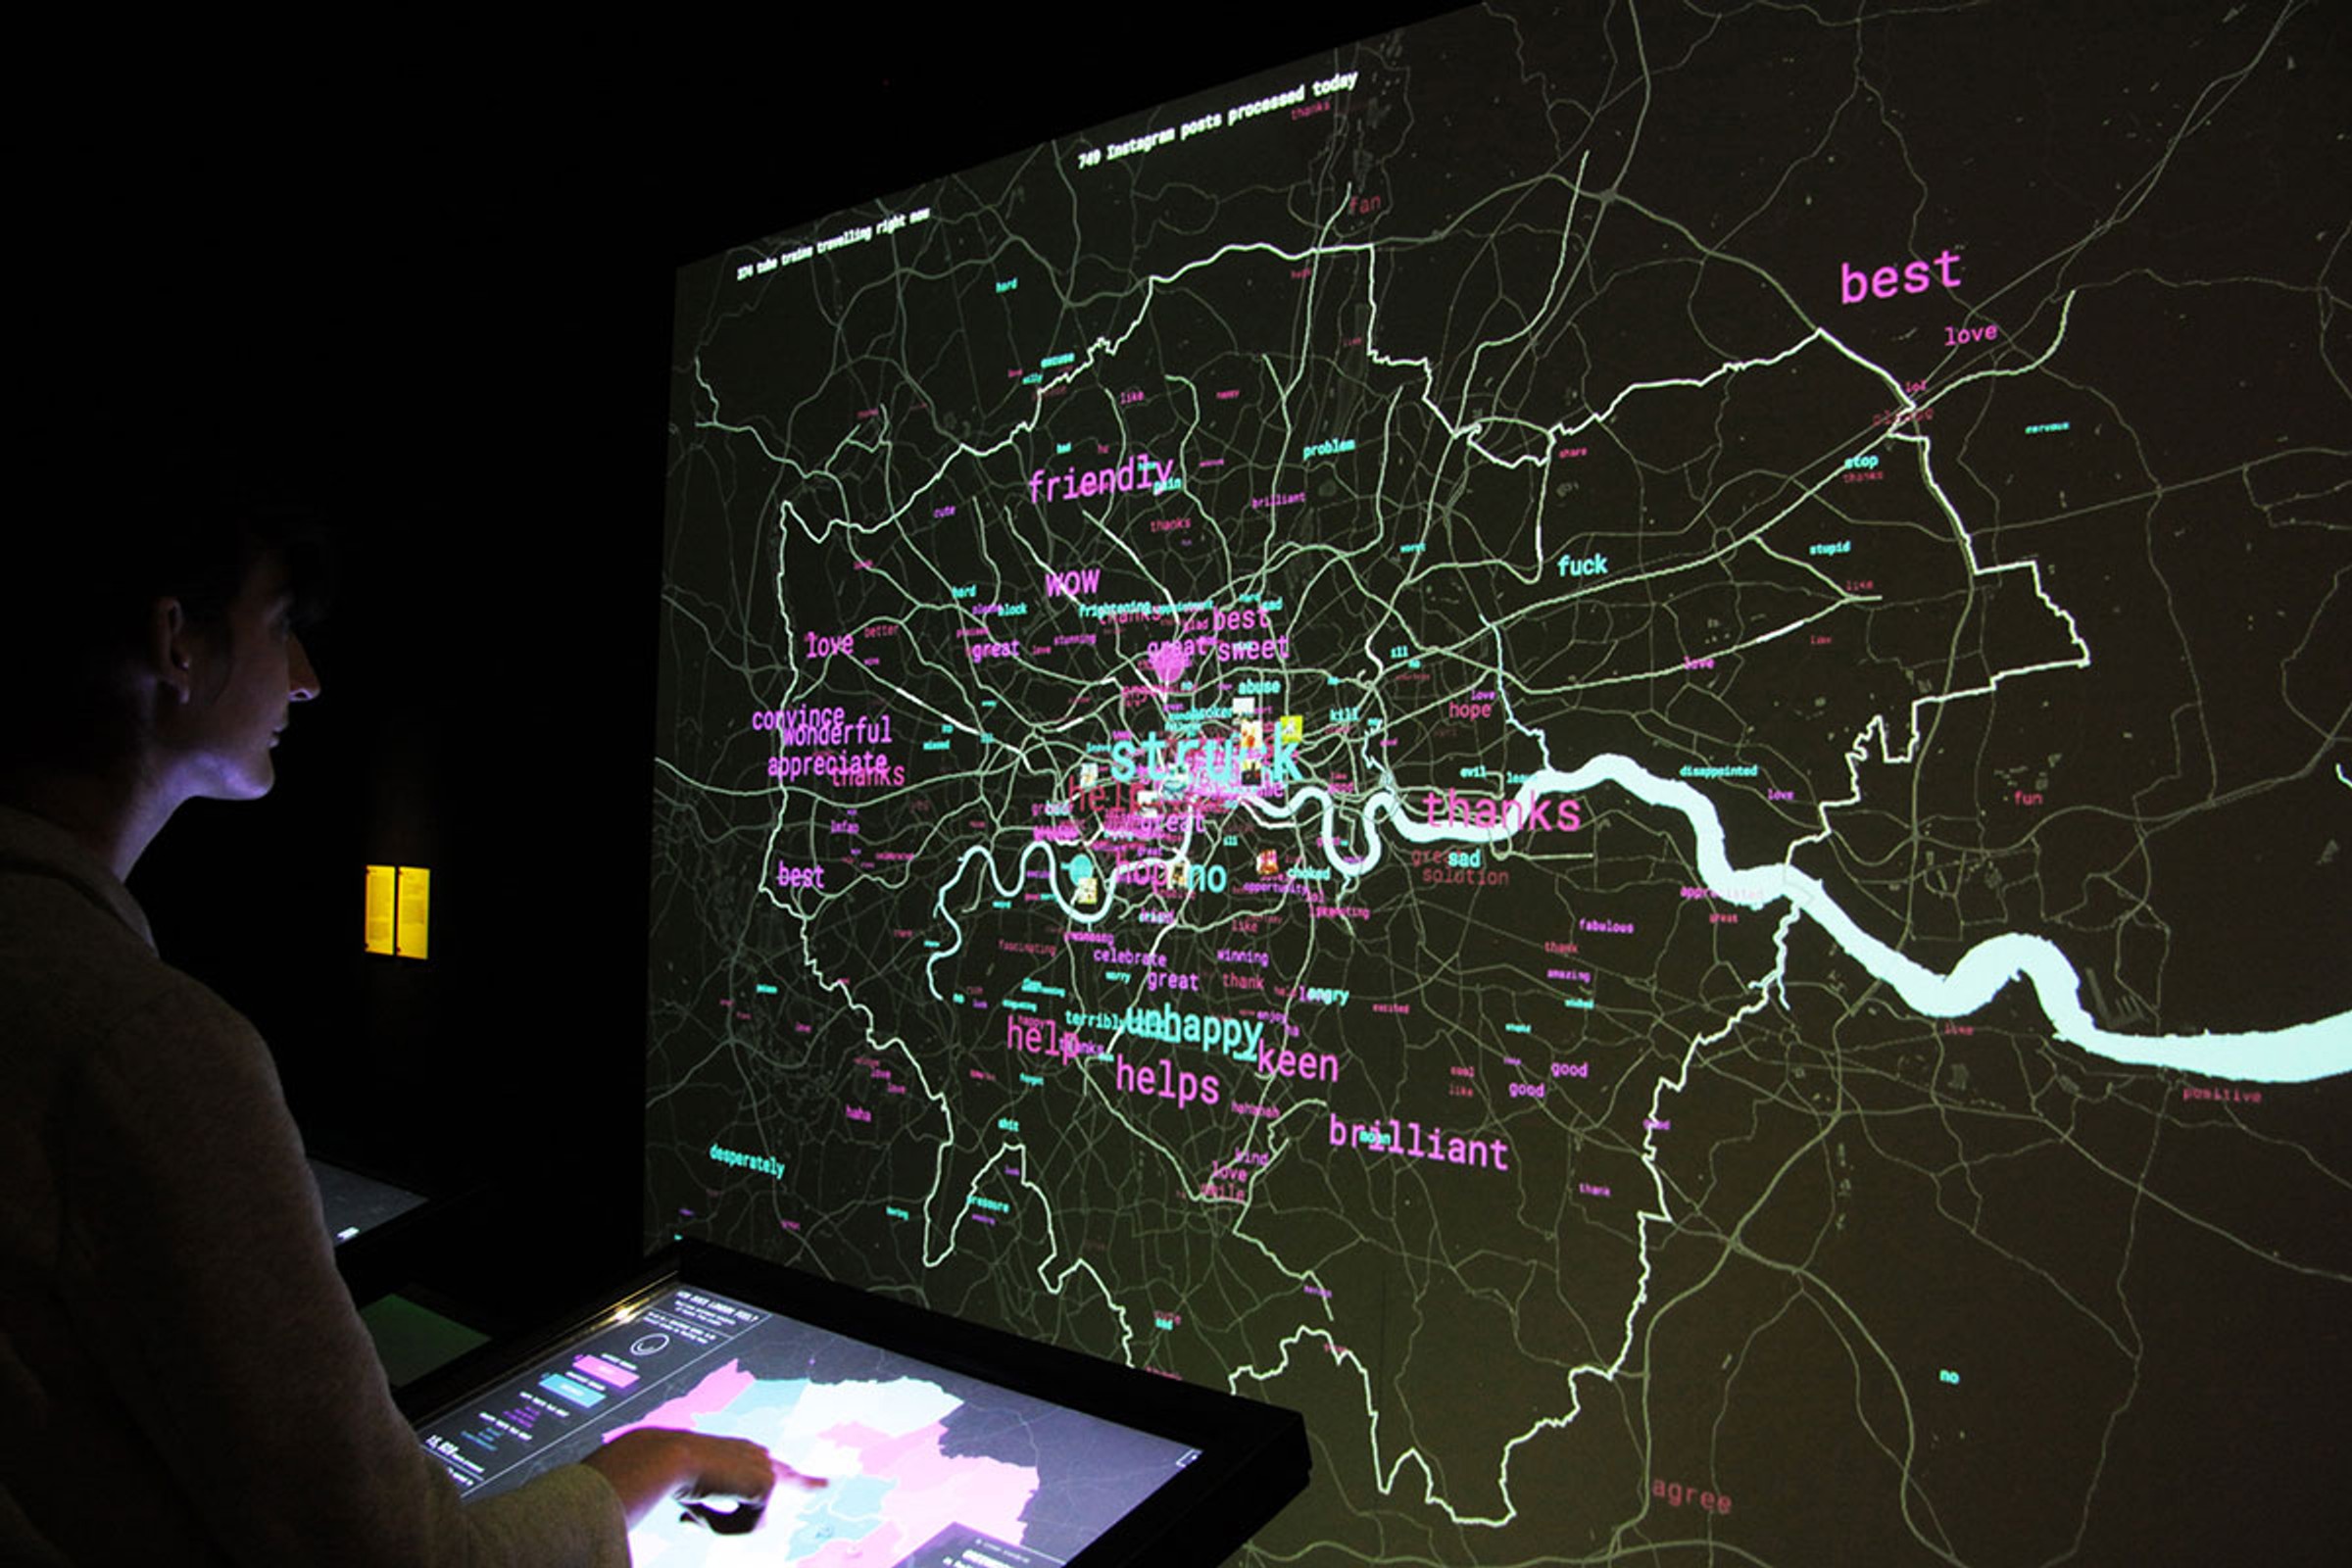
London Data Streams
Tekja Data Visualisation
“Can the data we produce tell us what London is thinking, seeing and feeling?” Pursuing this question London Data Streams is aimed to visualize the rhythms of London's live data ranging from Twitter posts and Instagram photos to Transport for London updates. As part of an exhibition, the datasets were represented in various levels of transformation and aggregation. This project is a particularly strong submission with high aesthetic quality and conceptual depth.
 Jounalistic
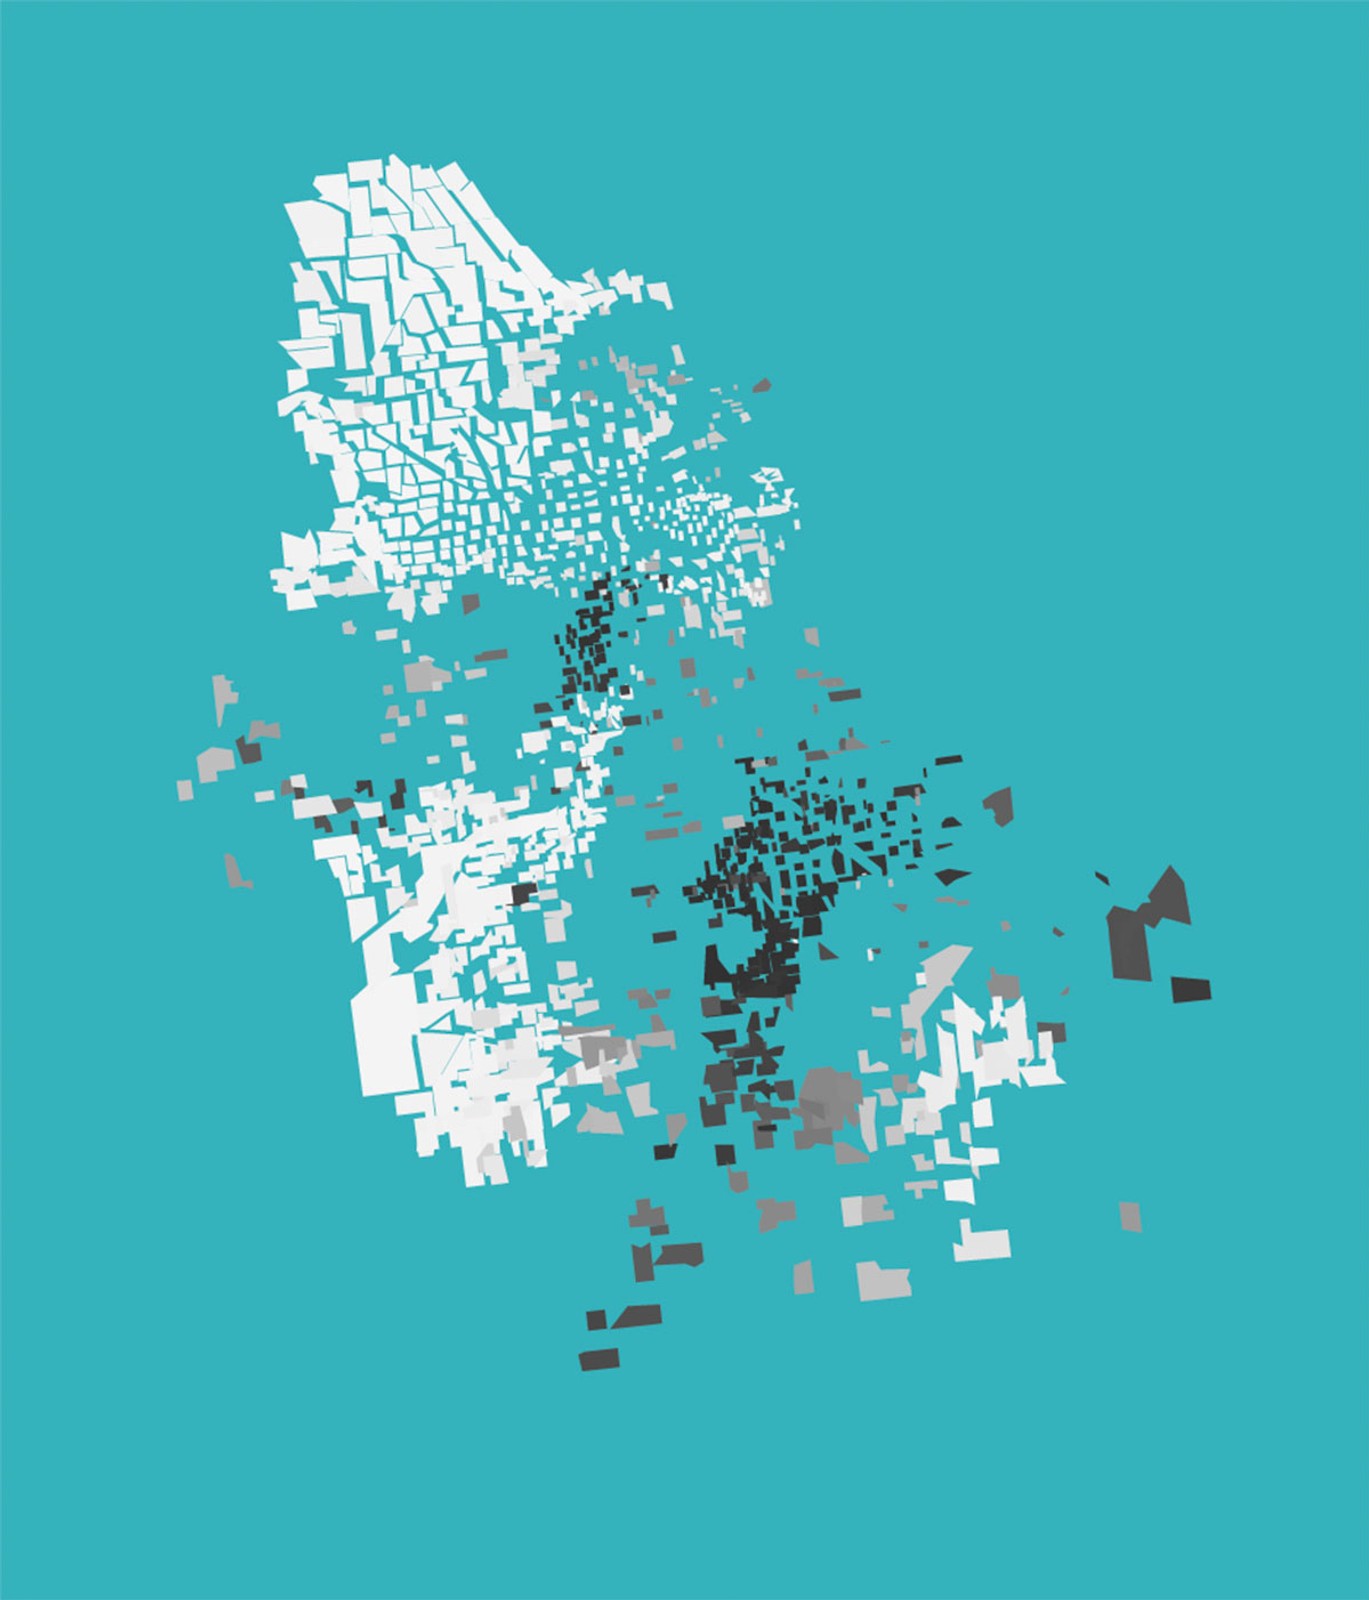
“Visualizing The Racial Divide” offers a visual and visceral representation of racial separation in fourteen U.S. cities. Shapes representing urban districts are gradually pushed away from each other based on differing proportions of white and black populations. Where there is a significant change in the racial makeup between neighborhoods, wider gaps are emerging. The form chosen here is novel and intruiging, with a startling and provoking effect on the viewer.
 Civic
Civic
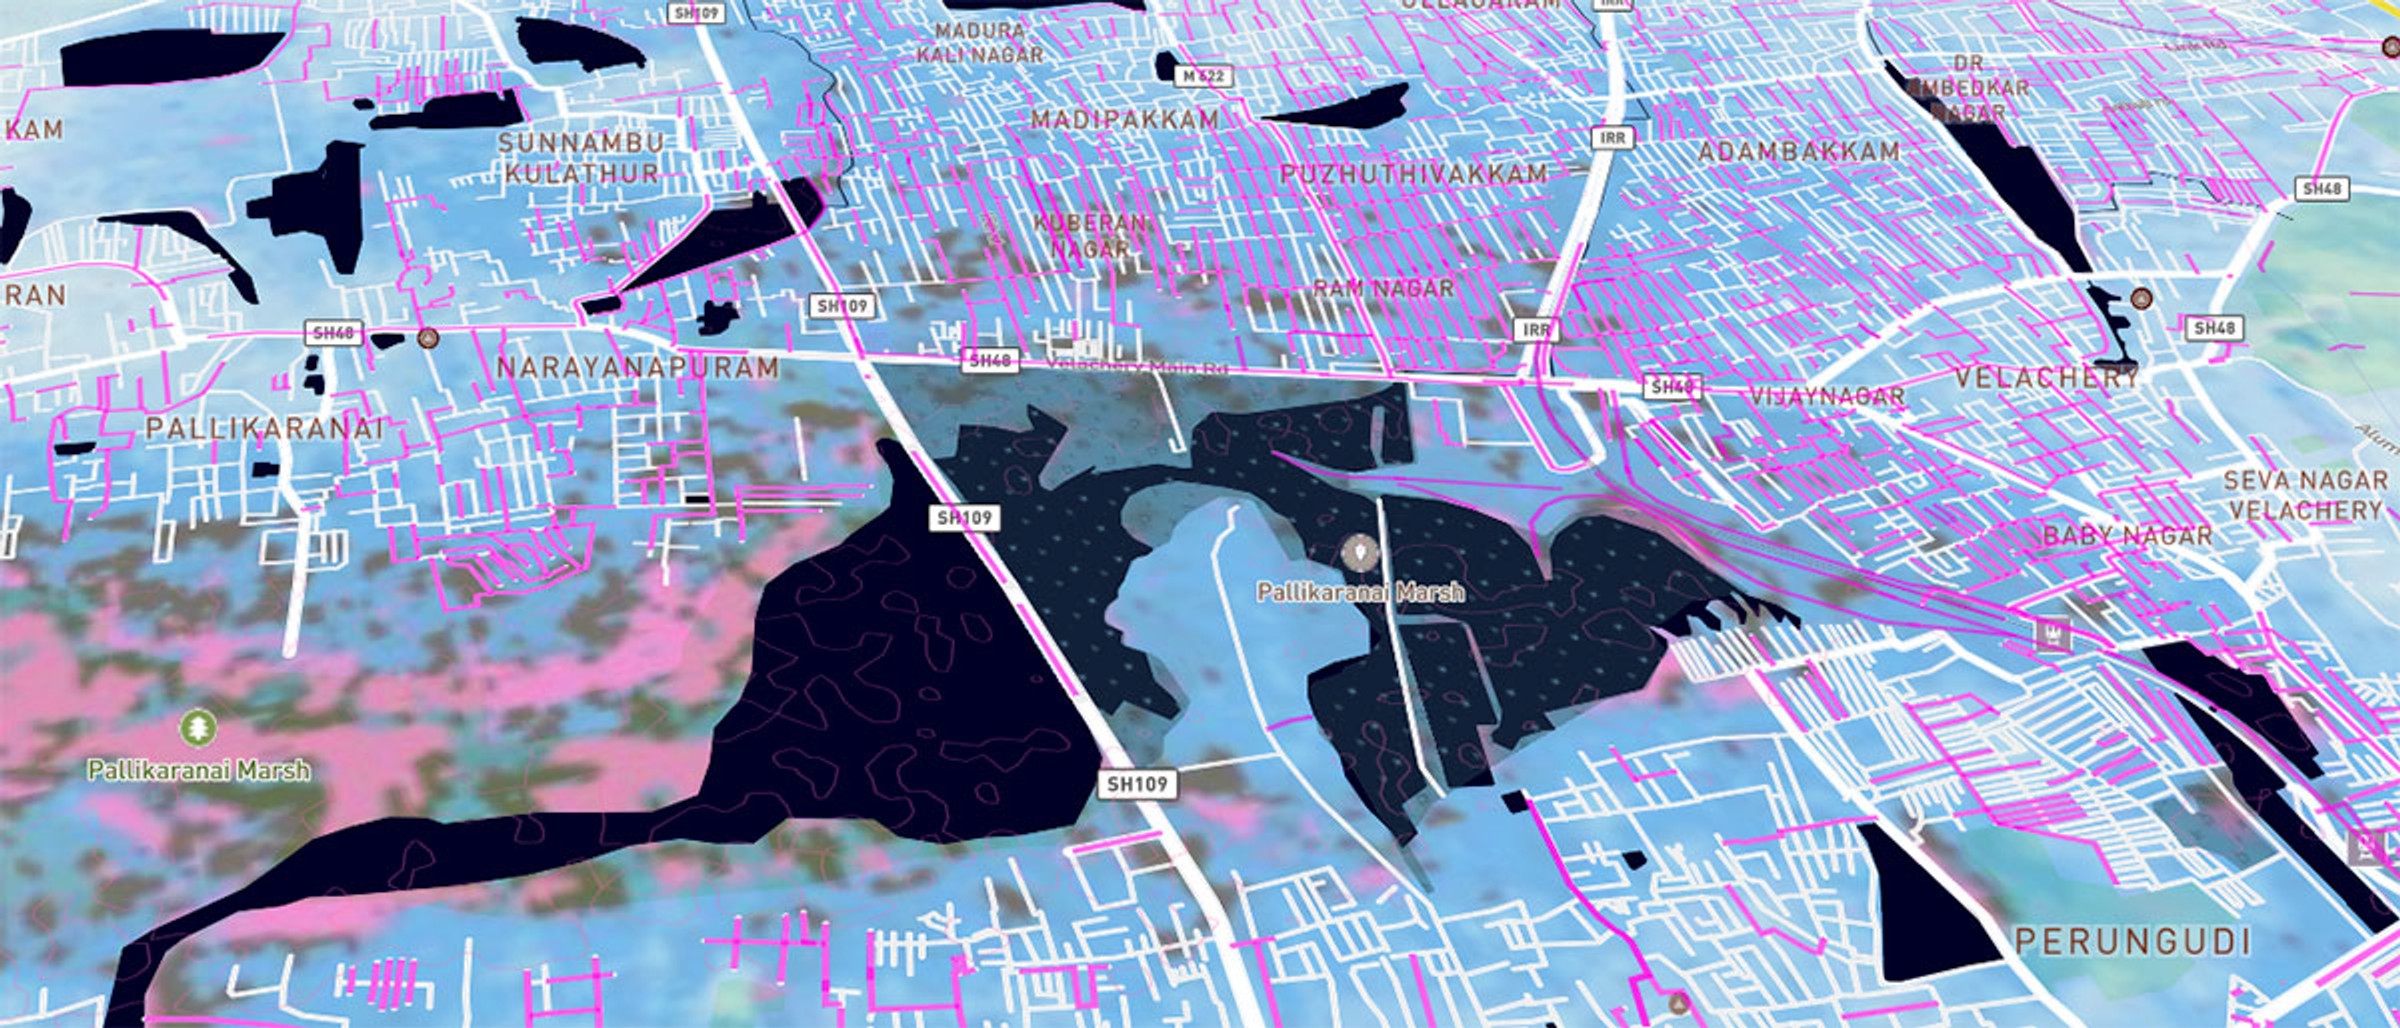
Chennai Flood Map
OpenStreetMap India / Mapbox
In the wake of unprecedented rainfall affecting the south Indian city of Chennai open source technology activists quickly created a reporting tool to crowdsource the location of flooded roads on an interactive mobile friendly map. The map had over 1 million views and collected over 15,000 reports of inundated street segments,and was widely used for research and relief work. This effort illustrates the great utility that visualization can have in grave situations.
 Student
Inclusive Maps
Students of Interface Design at University of Applied Sciences Potsdam
The core concept of this project is to illustrate that every map is specific and no map can be universally useful for everyone. Instead the special needs of its users need to be considered. The student team behind Inclusive Maps proposes novel map concepts especially for persons with impairments. The idea is not just novel, but also significant and applicable to any city across cultural differences.
Organizers
Chairs
- Marian Dörk FH Potsdam
- Owen Gaffney Future Earth
- Sebastian Meier FH Potsdam
Program Committee
This project is a collaboration between the International Council for Science (ICSU), Future Earth and the University of Applied Sciences Potsdam (FHP). The project selection for the Habitat III exhibition is conducted through a review process of an international expert committee. The international program committee consist of experts from visualization research, urban sciences and communication.
- Gregor Aisch New York Times
- Natalia Andrienko Fraunhofer Institute AIS
- Gennady Andrienko Fraunhofer Institute AIS
- Lyn Bartram Simon Fraser University
- Michael Batty UCL
- Maja Brisvall Quantified Planet
- Paolo Ciuccarelli Density Design
- Catherine D'Ignazio Emerson College
- Jason Dykes City University London
- Christina Elmer Spiegel Online
- Priscila Farias Universidade de São Paulo
- Manuela Garreton Pontificia Universidad Católica de Chile
- Daniel Gonzalez HERE
- Xaquín GV Guardian
- Drew Hemment University of Dundee
- Dan Hill Arup
- Andrew Hill CartoDB
- Hendrik Lehmann Tagesspiegel
- Ben Lowden HERE
- Shannon Mattern The New School
- Alan McConchie Stamen
- Greg McInerny Oxford University
- Timon McPhearson The New School
- Rodrigo Medeiros IFPB
- Isabel Meirelles OCAD
- Benedict Moran Independent filmmaker and journalist
- Till Nagel Hochschule Mannheim
- Santiago Ortiz Moebio Labs
- Bharath M. Palavalli Fields of View
- Randy Sargent Carnegie Mellon University
- Saskia Sassen Columbia University
- Markus Schläpfer MIT
- Sofia Seifarth Norrköping Visualization Center C
- Moritz Stefaner Truth & Beauty operator
- Andrew Vande Moere KU Leuven
- Nina Valkanova CIID
- Jan Willem Tulp Tulp Interactive
- Sarah Williams MIT
- Jo Wood City University London
- Martin Zaltz Austwick UCL